Thoughts on Kanban and Queueing Theory
I have observed that a lot of people misunderstand Scrum. Too often they do what has been called “ScrummerFall” or “Cargo-cult Scrum,” the most common failing being taking their current process and merely applying the Scrum-ish terms to whatever they’re doing now.
I’m seeing the same thing, if not more so, in Kanban, most notably when people claim to be doing Kanban but don’t have any WIP limits. I think it’s worse in Kanban because queueing theory is so very counterintuitive. Proof: we have traffic jams, lots of them, all the time. If we intuitively understood queueing theory, that wouldn’t be the case.
So, let’s start off with a simple quiz: which of the following are true and which are false?
- Shipping more frequently is the goal.
- The more productive a team is, the sooner you can ship.
- High team utilization is a good thing.
- Projects will be more successful if you get them right the first time.
I’ll answer each of these as we go along, but if you want to see the answers now, click here.
Kanban Beginnings
The word “Kanban” comes from Japanese, where it means “signal” or “signboard.” It came from the Toyota Production System, developed in the auto manufacturing industry between 1948 and 1975.
The main idea is this: the American way to produce car parts (say, hoods) is to set up this huge machine and let it stamp out a bazillion hoods, because once it got going, it was nice and reproducible. But if you stopped it, you’d have that warm-up time again where it was producing less-than-perfect hoods, until it was warmed up. So, in the American way, you make a pile of hoods (inventory) and have them on hand for when you make the rest of the car.
At the time, Japanese cars were not of high quality, but Kanban really turned that around. The idea is exactly the opposite of having a big pile of inventory and instead building just what you need, just when you need it: just-in-time or JIT. And they did it with these signal cards. For example, if you are a worker in a factory making cars and you need a radiator, you go to the radiator station, take the one radiator that’s there and replace it with a card for the radiator-maker that says, “Make another radiator.” The same thing happens with all the other parts.
And that allows you to be responsive to the market: if you need to start building supercharged-turbocharged-EV-hybrid cars all of a sudden, you’re in a good position to do so. Now, doing just-in-time isn’t easy. When they first started on this path, it took Toyota engineers and technicians two weeks to set up the press machine to stamp out hoods, but after a while, they got the setup time down to an hour. That’s a great story, because Japanese cars are of extremely high quality now. But how does this apply to software?
For starters, it answers the first question of our quiz: “is shipping more frequently the goal?”
The answer is No: Responsiveness or shorter cycle time is the goal.
For example, you could ship a product every week, but still have 3-year-long pipeline: not responsive. Alternatively, you could ship a product every week, and have a 2-day-long pipeline: very responsive.
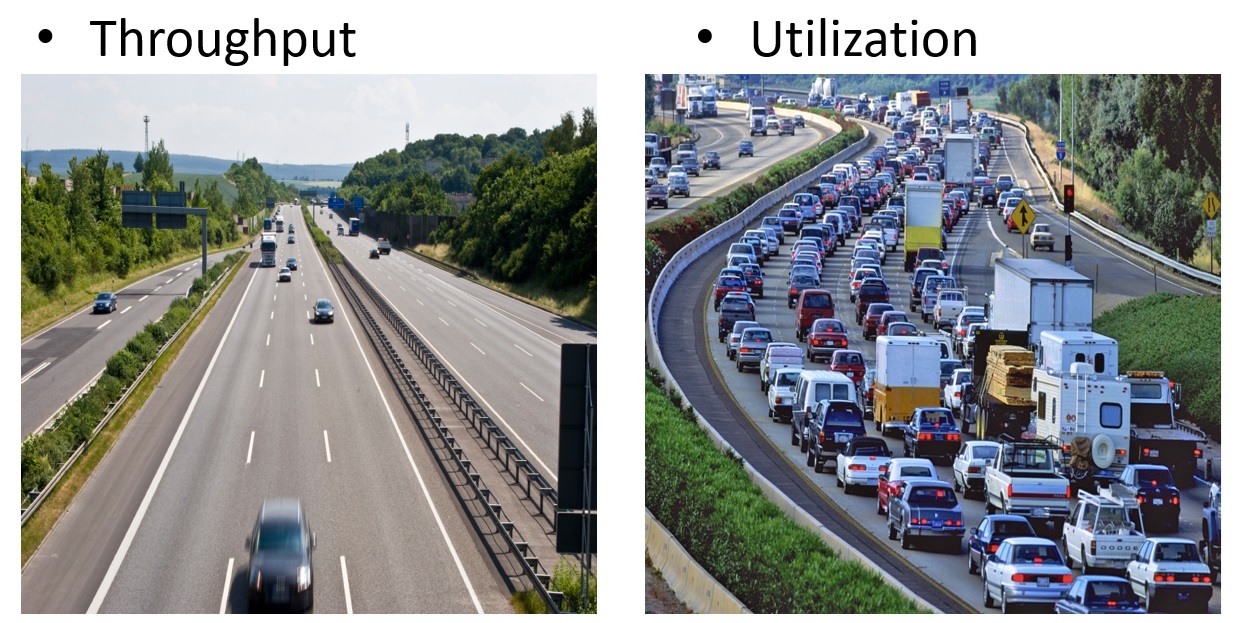
This is our first queueing theory fact: cycle time and throughput are separate characteristics of a queue.
Kanban Overview
For a review (or overview) of Kanban, click here.
Calculating Cycle time
Cycle time is the time from when a card is first pulled from the backlog until it’s put into the Final Done pile.
While a card is sitting in the product backlog, it doesn’t count against cycle time, because there’s been no work done on it, not even design: each card is just a story and maybe some “done” criteria.
It’s like someone starts a stopwatch when the card is pulled from the backlog and stops the watch when putting the card in the final done column. And in fact, in reality, with a physical Kanban board, it’s a good idea to write the date and time on the card when it’s pulled from the backlog and again when it’s moved to the final done pile. The difference between these two timestamps is the cycle time for that card.
Kanban Simulator Exercise
When I was a dev-instructor at StupendousCorp, when teaching our Agile/Estimations/Kanban class, I would talk about cycle time and queueing theory, and though people nodded, I could tell from what they said they didn’t really get it. No further explaining was going to help, so I wrote a Kanban simulator to allow them to get a feel for it.
So, here’s an exercise. Suppose you have a tiny team with 1 UX person, 1 Dev person and 1 QA person. And suppose the UX worker gets 3 cards done in a day, dev gets 2 cards done per day, and QA does 1 card per day.
Clearly, throughput is completely determined by the slowest step, which in this somewhat contrived case is QA. So I’m setting up some bottlenecks.
Your task is to minimize cycle time, but do so cost-effectively. One way to shorten cycle time is to hire more people, but that’s expensive and you don’t have budget. So you can’t do that. You’ve already hired the best people you can find, so more training or other techniques to increase QA’s output are not going to work.
All you can fiddle with is the WIP limits. Go ahead and play with the Kanban Simulator, until you have cycle time (also called “Sojourn time”) minimized.
Click here to see if you got it right.
Here’s the important bit: changing the WIP limits didn’t change the throughput - it’s still 0.97 cards per day (it’s not exactly 1.00 because of “entrance effects”: it takes a day or two for the first card even to get to the bottleneck at QA).
This answers our second question from the quiz: “Will a more productive team ship sooner?”
The answer is No: cycle time is independent of throughput.
This has been known empirically for quite a while, but was proven mathematically in 1961 by John Little, known as Little’s Law: L = λ * W, where L = average queue length, λ = average arrival rate, and W = average cycle time. Given two of these variables, you can calculate the remaining one. So, in our exercise, the rate at the bottleneck is .97, and the shortest cycle time is 2.94 days, giving a WIP of just about 3, which is exactly what we’ve got: 1 card each per UX, Dev and QA.
Here’s another important bit: if you see work piling up, it’s just sitting there aging, which means cycle times are long. Long queues imply long cycle times.
So, UX (or dev) being idle doesn’t hurt the throughput. But it does present an opportunity: those idle resources can swarm on the bottleneck, which will increase throughput.
T-Shaped Resources
Ideally, we want idle resources to swarm on the bottleneck, but the question always arises: if I’m a UX person (and cannot code), how can I help devs or QA? Similarly, if UX is the bottleneck, how can devs or QA help with UX work?
The answer is simpler than you might think: do anything you can; run errands for the bottlenecked workers; get them coffee; pair with them. After observing them for a while, you might even become a T-shaped resource: someone with deep expertise in one area but a little bit of expertise in upstream and downstream tasks. Ideally, you’ll become an M-shaped resource with depth both up- and downstream.
Here’s a quick story: I was pairing with a non-coder, Alex, on his tasks when his boss walked by. She spoke to him for just a minute and then left. Alex turned to me and said, “Wow, this pairing really works. Usually, she would have chatted with me for an hour.” Conclusion: even doing very little can result in helping the throughput at the bottleneck.
Utilization
Our intuition totally fails us when we think about utilization. We think, “If someone’s idle, he’s not helping at all. Therefore, let’s keep everyone busy.” And that’s completely wrong:
We already talked about how having one or more idle resources who swarm on the bottleneck increases throughput.
This section answers the third question from our quiz: “Is high team utilization is a good thing?”
The answer is No: high team utilization is a bad thing because the throughput won’t change, but the cycle time will get really long.
There’s actually a closed-form formula for this, for the case of an M/M/1 queue; see the link for the derivation. That’s a system where arrivals are random (“Markov”), service time is random (the second M), and there’s 1 server. This isn’t actually the kind of queueing system we have, but the utilization curves are all similar.
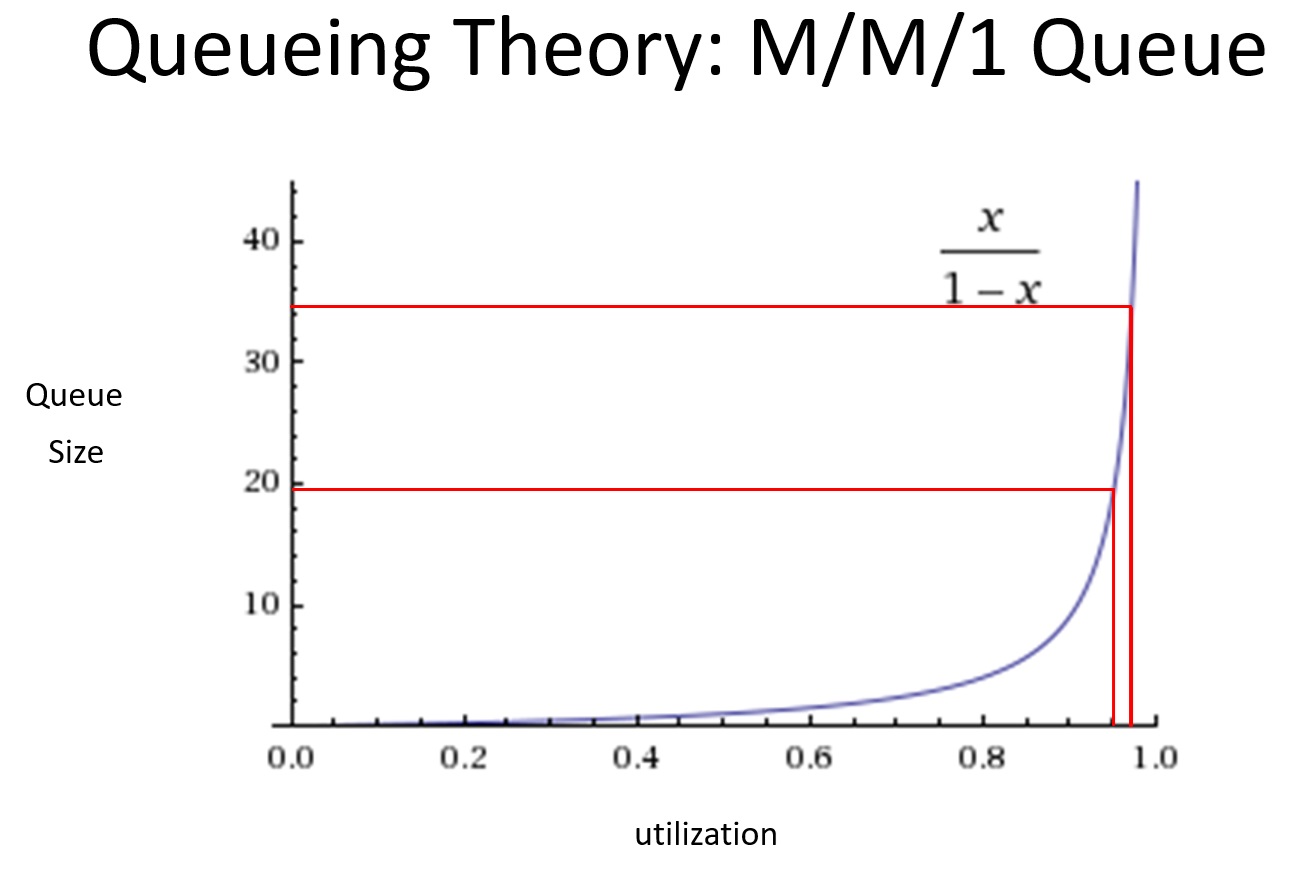
The important thing to note is that there is a pole at x = 1; that is, the queue length goes to infinity when utilization is 100%. And that means that cycle time skyrockets, too.
Notice also how steep the curve is at the far right: at 95% utilization, the queue size is 19, but at 97.5%, the queue size is 32.333. A small increase in utilization had a large increase in queue size and cycle time.
We don’t want to be anywhere near that. Rather, 50% utilization means a queue size of 1.
To be clear, the worker at the bottleneck is at very high utilization, but the others should be idle and swarming.
Estimating, 2nd Order Ignorance and the OODA Loop
I’ve discussed how to estimate elsewhere but it’s good to read that over again.
To apply it to our Kanban board, each week we update the spreadsheet that generates a cumulative flow diagram by counting up the items in the product backlog, and counting up all the items in the final Done column. That’s it; that’s all you need.
One important thing to note is that there will always be “2nd Order Ignorance” (2OI), the “unknown unknowns.” You must account for all the unknown unknowns, things that you didn’t even realize existed when you first started the project. Realize that they’re there, track their rate of discovery and utilize that information. Therefore, your first whack at a project will never be entirely right.
This answers the last question: “Will projects be more successful if you get them right the first time?”
The answer is No: it’s impossible to ‘get it right the first time.’
That’s the flaw in Waterfall or Big Design Up Front, and is the reason Agile even exists.
An example from a very different industry is military tactics: Boyd’s Law states, “Speed of iteration beats quality of iteration.” You can read about the OODA loop here. Scroll down to the section marked “OODA: Observe, Orient, Decide, Act” where the author, a CTO, recounts the story of Colonel John Boyd, a fighter pilot and military strategist. (I’ll wait while you read that.)
It’s a great story, repeated all over, but some of the details are a little wrong: the F-86 wasn’t entirely outclassed by the MiG-15, and the kill ratio wasn’t as high as claimed. The reality was that both planes were superior in some areas but not in others and the kill ratio was actually about 3:1.
Nevertheless, Colonel Boyd’s conclusions support the idea of iterating:
Observation
- F‑86 pilots had better situational awareness due to canopy visibility and radar‑assisted gunsight
- U.S. command‑and‑control provided more reliable information flow
Orientation
- U.S. pilots had far more WWII combat experience
- They adapted tactics faster and internalized lessons more quickly
- Soviet/Chinese/North Korean pilots were often flying rigid, doctrine‑driven patterns
Decision
- U.S. pilots made quicker tactical choices because they weren’t bound to strict engagement rules
- They could improvise and exploit fleeting opportunities
Action
- The F‑86’s superior roll rate and high‑speed handling let pilots execute decisions faster
- The MiG‑15’s advantages mattered less because its pilots couldn’t cycle decisions as quickly
All except for the first O (Observation) have to do with speed, and as the fighter pilots go through the loop many times during a dogfight, they’re iterating, and it’s to their benefit to do so as fast as possible. That is, they’re trying to have as short a cycle time as possible.
And so should we in our development process if we want to be responsive to the market; just like Toyota, just like JIT, just like Kanban.
Conclusion
So, to recap my thesis here, that queueing theory is extremely counterintuitive, here’s the quiz again whose statements seem so reasonable, with answers:
- Shipping more frequently is the goal.
- False. Shorter cycle time is the goal.
- The more productive a team is, the sooner you can ship.
- False. Cycle time is independent of throughput.
- High team utilization is a good thing.
- False. Higher utilization implies longer cycle times.
- Projects will be more successful if you get them right the first time.
- False. Boyd’s Law states “Speed of iteration beats quality of iteration.”
That’s all for now, though you may want to read my post on the best way to handle bugs in Kanban.
Back to MiddleRaster’s pages.